So, it all started at IRIS NITK, where I had the chance to work with some seriously cracked individuals, and we were testing out different distributed strategies for MariaDB. While I didn’t have a ton of time to dive super deep, I was picking up some gems here and there. The real kicker? A bunch of the guys were working on eBPF based tools for their own projects/academics, and that’s where I first got exposed to eBPF. Safe to say, the tech rizz was strong.
Once my summer internship wrapped up and I had some breathing room, I decided to channel that extra time into learning eBPF by building my own monitoring tool. I finished building it but didn’t get around to testing or using it for quite some time.
So, I finally decided revisiting it to see if it’s actually any good.
Before starting the comparison, let’s first see what the program does and how it works. The MariaDB/MySQL eBPF exporter collects query latencies just as the name suggests by hooking into the initial query execution function named dispatch_command() (in both MySQL/MariaDB, though they behave a bit differently) and then normalizes the queries to help categorize similar ones together. It then exports this data as Prometheus metrics, which can be collected by a Prometheus server and visualized in Grafana.
I used libbpfgo for building the program, mainly for its CORE (Compile Once, Run Everywhere) capability, and also because I wanted to use Golang for the userspace part of the program. There was a challenge though: the compiled MariaDB/MySQL binaries have mangled function names, and libbpfgo can’t easily find and hook into those like bpftrace can (at least, I didn’t know a way). To handle this, I wrote a build script that uses the nm tool to extract the actual function name from the DB binary, stores it, and compiles the BPF object to hook into it. This object is then embedded into the Go program using Go’s embed package, ensuring it always runs with the DB version it was built for.
If you’ve ever worked with libbpf, you’d know how tricky it can be to set up everything properly. So, I also made sure the whole thing could be compiled and run inside Docker. I wrote scripts to build it in a container, assuming the required kernel packages are available in Ubuntu’s default repos. Once it can run in a container, we can also attach it to a database running on the host or in another container, by starting the container in the respective process namespaces.
Now that we know what the program can do, the next question is how it affects performance compared to running raw (with no monitoring) and existing monitoring methods like performance_schema and slow query logs. Since there’s already a solid comparison between the latter two (PERFORMANCE_SCHEMA vs Slow Query Log - Percona), I only compared my tool with raw and performance_schema.
Some points to consider before testing:
- Query fingerprinting/normalization uses regex, which is CPU intensive and might impact performance. One idea to reduce this overhead could be to transfer data to another system for normalization/export.
- The program might still have room for optimization.
It also seemed interesting to test how the tool behaves when collecting only slower queries say, queries longer than 200ms or 1000ms. This makes sense, but the Percona blog explains why it’s usually not the best idea and suggests a better approach worth trying out later.
Benchmarking Configuration
sysbench scripts
Initially, I wanted to emulate a scenario where scripts would keep CPU and memory usage around 50–60% under raw conditions. This would let me observe how performance drops with the monitoring tool running. But keeping this balance consistently turned out to be complicated.
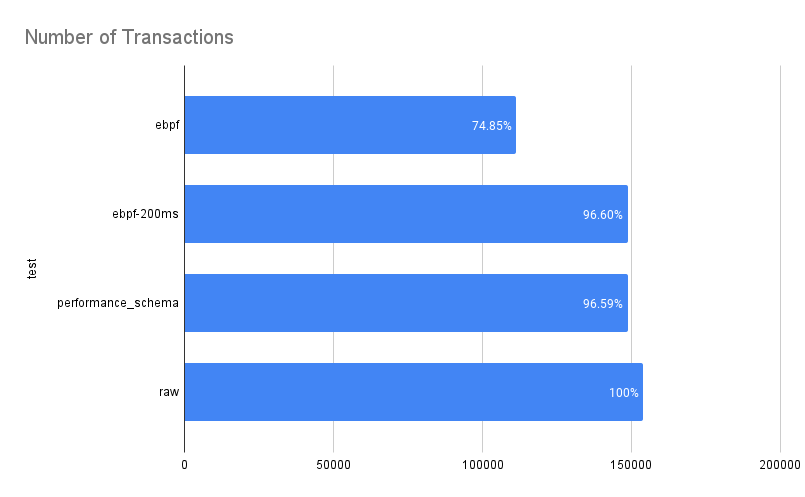
Instead, I switched to running default sysbench scripts. While this maxes out CPU/memory, it introduces a useful metric: the number of transactions executed, which helps gauge throughput and performance impact.
sysbench oltp_common --db-driver=mysql --table-size=100000 --mysql-user=root --mysql-password=L0CK3D_1N --mysql-port=3306 --mysql-host=10.128.0.3 --mysql-db=sysbenchtest prepare
sysbench oltp_read_write --db-driver=mysql --table-size=100000 --mysql-user=root --mysql-password=L0CK3D_1N --mysql-port=3306 --mysql-host=10.128.0.3 --mysql-db=sysbenchtest --threads=12 --report-interval=1 run
I also turned off indexing so queries would be slower, making it easier to generate a nice Grafana graph:
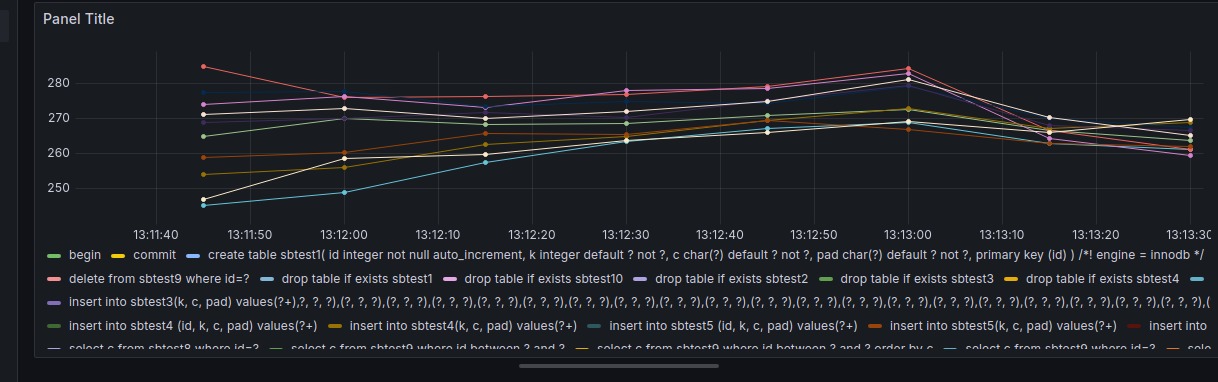
Query for the above graph:
rate(ebpf_exporter_query_latencies_histogram_sum[1m])/rate(ebpf_exporter_query_latencies_histogram_count[1m])
Before each test, I ran a cleanup to clear caches:
sysbench oltp_common --db-driver=mysql --table-size=100000 --mysql-user=root --mysql-password=L0CK3D_1N --mysql-port=3306 --mysql-host=10.128.0.3 --mysql-db=sysbenchtest cleanup
performance schema
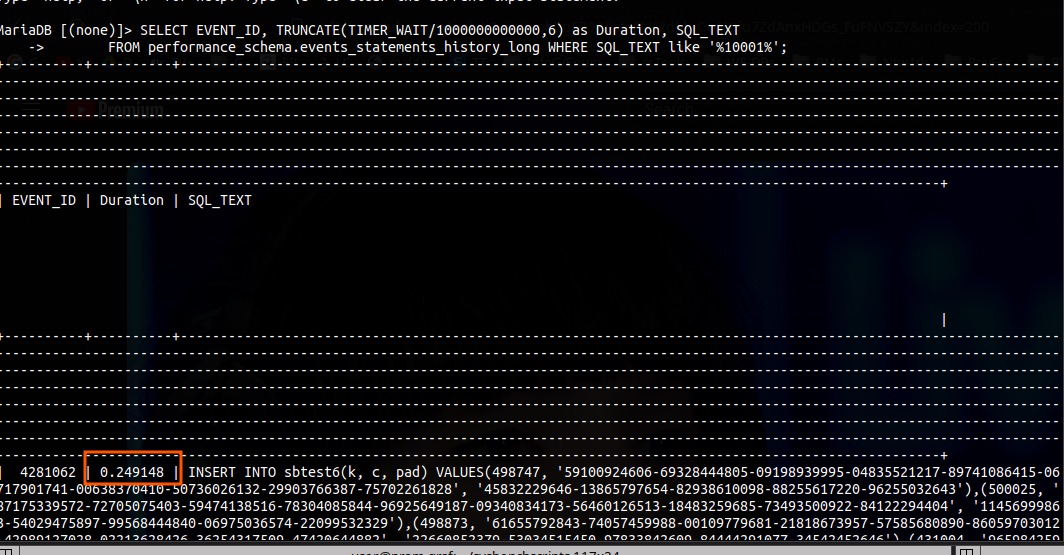
For configuring performance schema, I followed this guide: Query Profiling Using Performance Schema
Example of how query latency data looked:
Process Exporter
I had the Process Exporter logging CPU and memory usage, but unfortunately missed the Prometheus retention window. No screenshots or backups this time.
System Configuration
GCP instances:
2x e2-standard-2 (2 vCPU, 1 core, 8 GB memory)
OS: Debian
Benchmarking
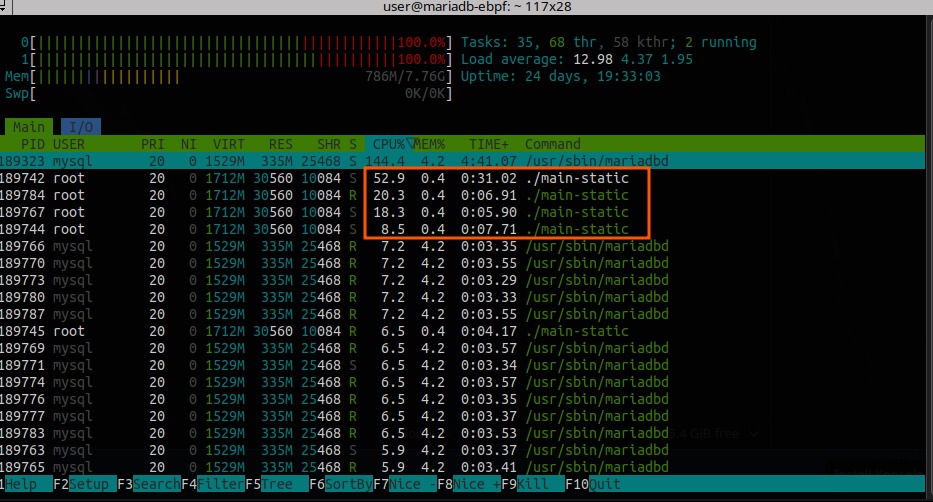
I started by having the eBPF exporter capture all queries, even 0ms latency ones, and it did use quite a lot of CPU:
This changed significantly when filtering to only collect queries over 200ms CPU and memory usage dropped, and the benchmarks reflected that.
Results
Each test was run three times and averaged. Full results can be found here.
| test - averages | read_queries | write_queries | total_queries | transactions | total_time | total_events | min_latency | avg_latency | max_latency | 95th_latency |
|---|---|---|---|---|---|---|---|---|---|---|
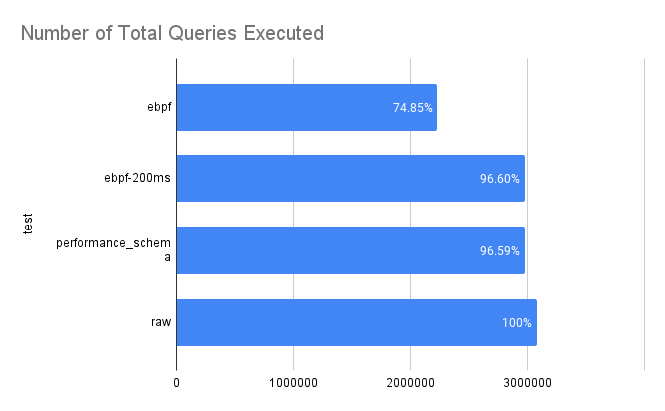
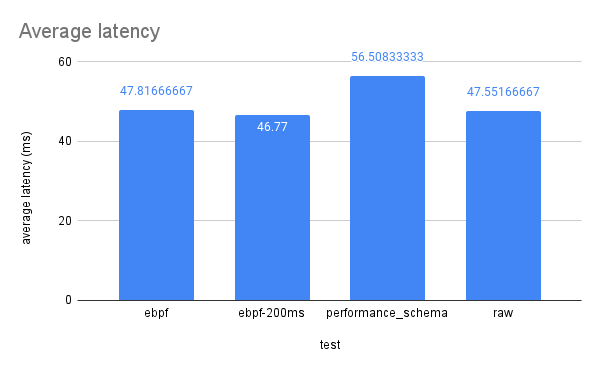
| ebpf | 2108526 | 602436 | 3012180 | 150609 | 300.0397 | 150609 | 8.343333333 | 47.81666667 | 375.13 | 89.27 |
| ebpf>200ms | 2155041 | 615726 | 3078630 | 153931.5 | 300.0355 | 153931.5 | 7.425 | 46.77 | 378.97 | 94.1 |
| performance_schema | 1821535.333 | 520438.6667 | 2602193.333 | 130109.6667 | 300.05895 | 130109.6667 | 8.648333333 | 56.50833333 | 318.805 | 86.785 |
| raw | 2120234.667 | 605781.3333 | 3028906.667 | 151445.3333 | 300.0370667 | 151445.3333 | 8.206666667 | 47.55166667 | 365.9416667 | 90.595 |
Graphs from Google Sheets: